Discover why you won't be able to live without TrackAd
Unified vision
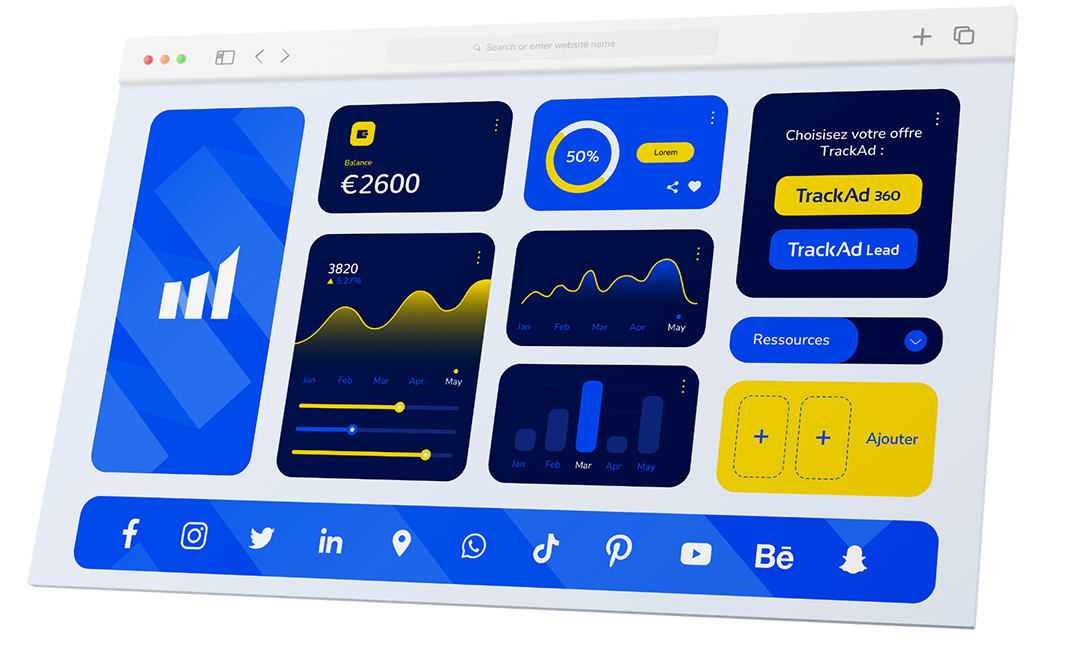
Find all your data sources in one place.
Merge and centralize all your data in a single interface. Web and app analytics solutions, media platforms, commercial data: data is collected, processed, and presented to facilitate your decision-making. All that’s left is for you to make the call!
Master your Media Mix with Attribution and Contribution.
Measure the true effectiveness of your marketing channels, traffic sources, and acquisition campaigns with multiple attribution models. Create your own attribution models and identify the most relevant and effective channels in your conversion journeys.
Save more than half a day per week.
Say goodbye to time lost on repetitive and time-consuming tasks!
TrackAd allows you to automate data collection, closures, and reporting. With an average time savings of 5 hours per week, you can refocus on your high-value tasks (and maybe even bring that new idea you’ve been thinking about to life…).
Identify the true conversion journey of your targets.
Access the complete conversion journeys of your prospects and customers. Whether it’s leads or orders, TrackAd provides the full journey of each conversion: from the first impression to the last click, with the actual cost of each touchpoint.
CMO, Head of Acquisition, Traffic Manager, Affiliate Manager, CDO, Head of E-Commerce… Just like you, they wanted to optimize their advertising investments and save time.
Today, it’s done! Discover their testimonials.
The tool is ergonomic and simple, while remaining financially affordable. It’s “simple is smart.” I really appreciate the customizable aspect of the tool. It’s not about buying an attribution model, but about...
We have requested to set specific metrics and even ways of tracking (in first click instead of last click for different types of affiliates) and it was fast and effective. Now we...
We were facing issues with attribution, tracking the performance of our marketing channels, and data loss in Google Analytics. TrackAd enables us to be more responsive in managing our campaigns, thus improving...
We implemented the full TrackAd solution to track the performance of our digital campaigns and optimize our marketing investments. The tool is user-friendly and quite easy to use. Once the data sources...
I am 100% satisfied with the features of TrackAd Collector! It’s a tool with a simple and easy-to-use interface. I also appreciate the support from TrackAd’s Customer Success teams and their ability...
TrackAd is a tool that simplifies the lives of acquisition managers and traffic managers. The teams are proactive and make valuable suggestions to upgrade their service. In a challenging environment where data...
Every day, our teams work to help advertisers like you exceed their digital acquisition goals.
Whether you’re in e-commerce or lead generation, our mission is simple: to provide you with the technology and expertise necessary to achieve maximum ROI with every campaign.
Our Customer Success team is here to anticipate your needs, boost your performance, and support you. Their expertise, responsiveness, and friendliness are universally recognized by our clients.